Americans from across the political and economic spectrum are placing increased emphasis on environmental issues and the way in which the environment affects their lives and the lives of their neighbors and loved ones.
Conservation, sustainability, organic produce: These terms have become more than mere buzzwords. The concepts that they represent are issues front and foremost in the minds of a significant number of American voters.
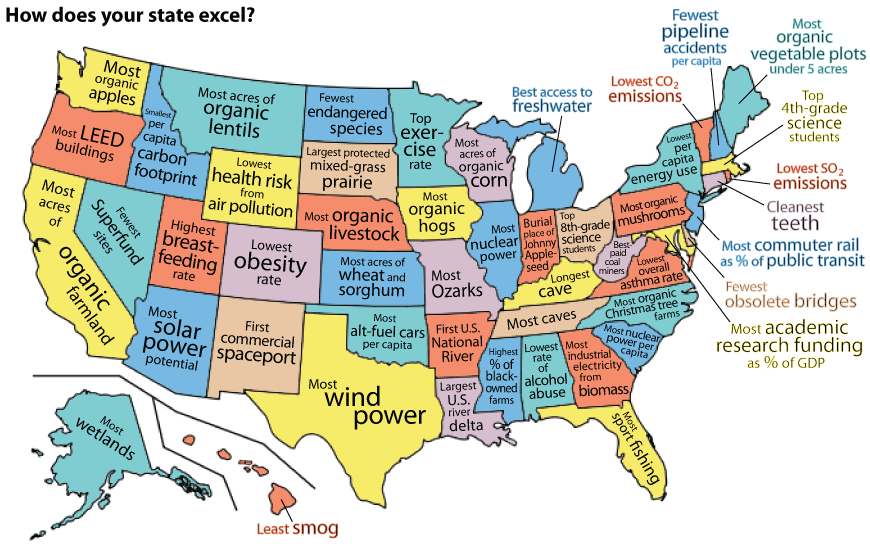
In an effort to provide a look at both halves of the glass in regards to such hot-button topics, Mother Nature Network unveiled a pair of maps in 2016 illustrating the respective environmental highs and lows of the 50 US states.
In the first map, pictured below, we get a break from the usual bad environmental news. From the obvious (Washington is home to the largest number of organic apples), to the hopeful (Texas generates the most wind power of any US state and you're probably not smarter than an 8th grader from Ohio), this map points reminds that not all the news is doom and gloom when it comes to the environment. Check out the this map and see what your state is doing right. [Click here to enlarge]
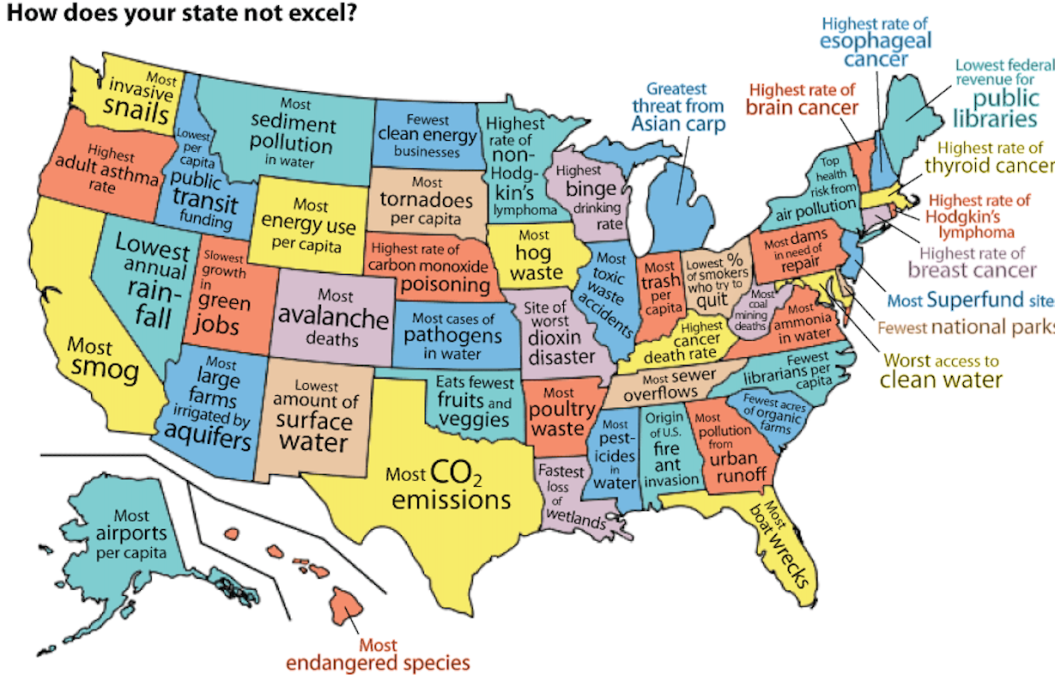
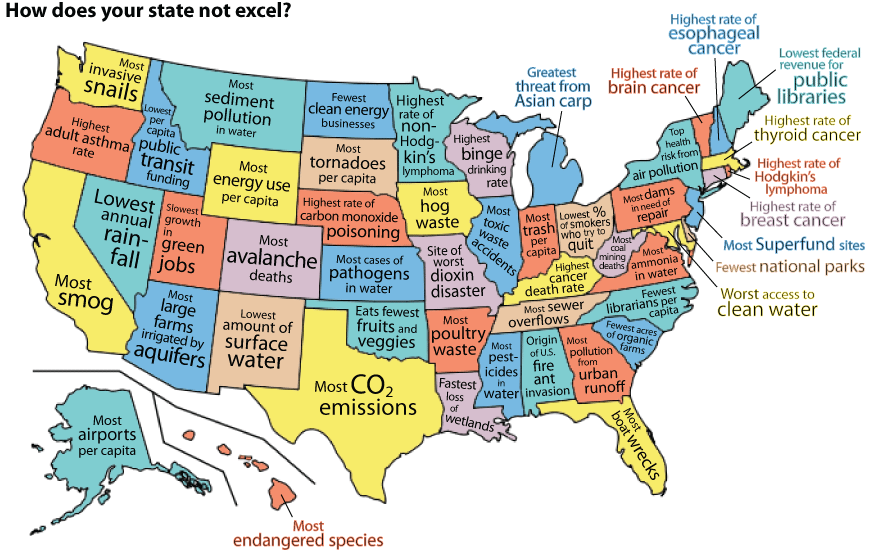
Cautious optimism may be in order, but it seems plenty of states still have work to do . The following map highlights some of the issues with which the US still struggles on the environmental front. Who would have ever thought Oregon would have the highest adult asthma rate? Or that South Carolina has the fewest librarians per capita and that a lot of folks in Ohio have no interest in going cold turkey?
Check out the following map to see which environmental issue most affects your state and see if there is a part you can play to help. [Click here to enlarge]
This story originally ran on Feb. 29, 2016.
