Have you ever wondered where your state stacks up when it comes to body weight?
This graphic from Canadian media site Mclean's uses findings from a report in the Canadian Medical Association Journal to compare the rates across the U.S. Each state is highlighted with a different color, signifying its individual obesity rate.
Mississippi came in as the state with the highest overall obesity rate (34.6%) in the United States. Louisiana, Arkansas, Alabama, Oklahoma and West Virginia also landed between 32% and 34%.
You can see the full chart below.
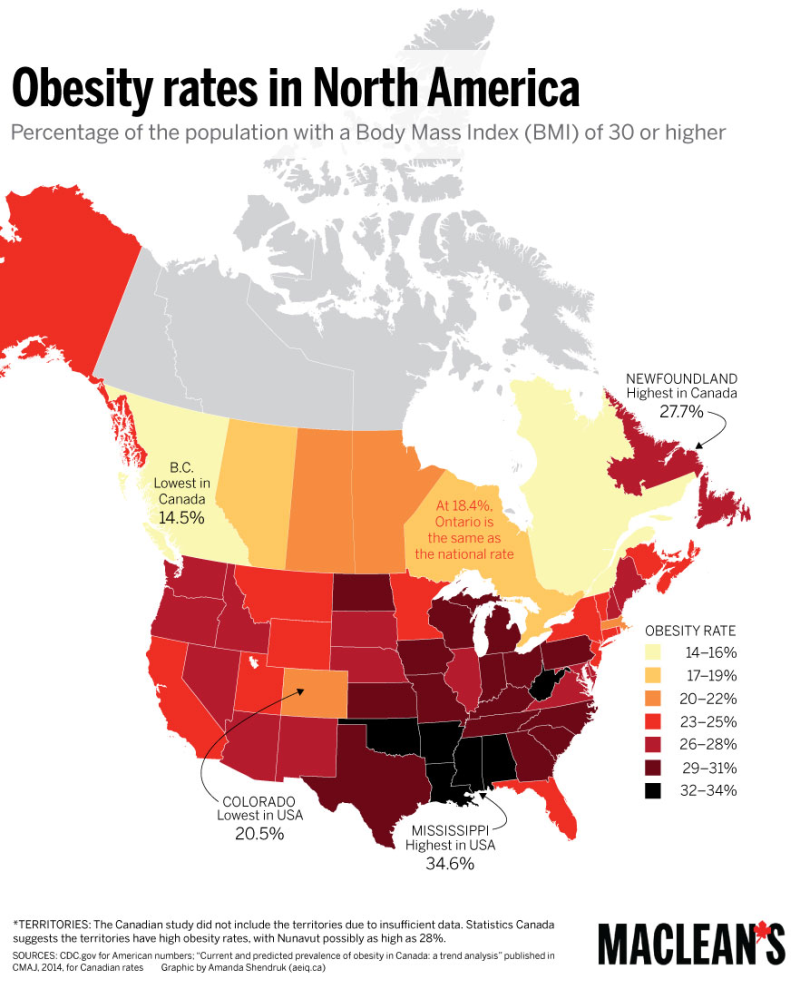
Maclean's
So why do these Southern states have such a high obesity rate? In general, high obesity can be linked to high rates of poverty, which the South is also known for. Those with smaller incomes tend to buy cheaper, more processed foods that have high fat content.
READ MORE: Map Shows the Largest Company in Each State
The Centers for Disease Control also found that more that 30% of residents in Mississippi, Louisiana, Kentucky and Tennessee did not engage in any exercise activities within a month. This lack of physical activity, mixed with other factors is the likely source of these surprisingly high obesity rates.
Where did your state rank on this list?